Motivation
Kubernetes Horizontal Pod Autoscaler (HPA) is a wonderful thing, but scaling only by CPU and memory metrics is just not enough in certain occasions.
Let’s say you have an SQS queue and you want to scale your pods by its length. The native HPA does not have support for this. That’s where KEDA comes in:
KEDA is a Kubernetes based Event Driven Autoscaler that works alongside the HPA to scale your pods by specific metrics or events. In this case, we’ll scale our pods by queue length.
I’ll divide this entry in 3 sections:
- KEDA explanation and configuration
- Deploying KEDA
- Testing autoscaling
Prerequisites
- EKS cluster
- SQS queue
Tools
1. KEDA explanation and configuration
How it works
I’ll give a high-level explanation about this, if you want to know more, I suggest you read the documentation 😉
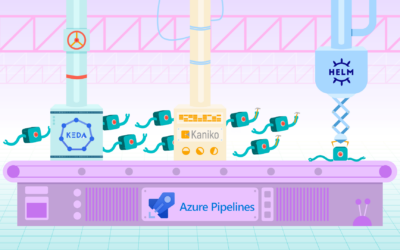
KEDA uses the metrics obtained by the keda operator metrics apiserver. With these metrics, the keda operator sets the ScaledObject to manage the HPA that controls the deployment. We need to deploy this ScaledObject in the same namespace as the deployment.
They say a picture speaks a thousand words, so here’s one for you 😀

Configuration
Before deploying KEDA we need to do some configurations:
- Create an IAM role for the
keda-operatorservice account, A.K.A IRSA. You can check its documentation here - Assign that role to the service account
- Set up pod security context
IAM Policy
This is the policy the operator needs to set the HPA. It only has access to the test queue.
{
    "Version": "2012-10-17",
    "Statement": [
        {
            "Effect": "Allow",
            "Action": "sqs:GetQueueAttributes",
            "Resource": "<SQS_QUEUE_ARN>"
        }
    ]
}
IAM Role
This role uses the policy we created in the previous step.
Once the role is created, we need to update the Trusted entities to associate the service account keda-operator to the role. Here’s the JSON:
{
  "Version": "2012-10-17",
  "Statement": [
    {
      "Sid": "",
      "Effect": "Allow",
      "Principal": {
        "Federated": "<OIDC_PROVIDER_ARN>"
      },
      "Action": "sts:AssumeRoleWithWebIdentity",
      "Condition": {
        "StringEquals": {
          "<OIDC_PROVIDER_URL>:sub": "system:serviceaccount:<KEDA_NAMESPACE>:keda-operator"
        }
      }
    }
  ]
}
This is one of the three roles you need to create:
1. Producer role: it needs access to send messages to the queue. ❌
2. KEDA operator role: we just created it. ✅
3. Consumer role: it needs access to send, receive and delete messages to the queue. ❌
2. Deploying KEDA
In order to deploy KEDA with the role and the security context, I had to modify the default values. To obtain the default chart values, you can execute these commands:
$ helm repo add kedacore https://kedacore.github.io/charts
$ helm update repo
$ helm show values kedacore/keda > values.yaml
Now we just add:
eks.amazonaws.com/role-arn: <KEDA_OPERATOR_ROLE_ARN>asserviceAccountannotation- Pod’s uid to
1001. This is done by modifying thepodSecurityContextaccording to this Issue #837
“But why?” I hear you ask. Well, with the role annotation we set the AWS credentials needed to access the SQS queue attributes and with the uid we avoid the problem shown in the issue.
Here’s the values.yaml for you, just in case 😉
# Default values for keda.
# This is a YAML-formatted file.
# Declare variables to be passed into your templates.

image:
  keda:
    repository: ghcr.io/kedacore/keda
    # Allows people to override tag if they don't want to use the app version
    tag:
  metricsApiServer:
    repository: ghcr.io/kedacore/keda-metrics-apiserver
    # Allows people to override tag if they don't want to use the app version
    tag:
  pullPolicy: Always

crds:
  install: true

watchNamespace: ""

imagePullSecrets: []
operator:
  name: keda-operator

metricsServer:
  # use ClusterFirstWithHostNet if `useHostNetwork: true` https://kubernetes.io/docs/concepts/services-networking/dns-pod-service/#pod-s-dns-policy
  dnsPolicy: ClusterFirst
  useHostNetwork: false

# -- Custom labels to add into metadata
additionalLabels: {}
  # foo: bar

podAnnotations:
  keda: {}
  metricsAdapter: {}
podLabels:
  keda: {}
  metricsAdapter: {}

## See `kubectl explain poddisruptionbudget.spec` for more
## ref: https://kubernetes.io/docs/tasks/run-application/configure-pdb/
podDisruptionBudget: {}
#  minAvailable: 1
#  maxUnavailable: 1

rbac:
  create: true

serviceAccount:
  # Specifies whether a service account should be created
  create: true
  # The name of the service account to use.
  # If not set and create is true, a name is generated using the fullname template
  name: keda-operator
  # Annotations to add to the service account
  annotations:
    eks.amazonaws.com/role-arn: <KEDA_OPERATOR_ROLE_ARN>

# Set to the value of the Azure Active Directory Pod Identity
# This will be set as a label on the KEDA Pod(s)
podIdentity:
  activeDirectory:
    identity: ""

# Set this if you are using an external scaler and want to communicate
# over TLS (recommended). This variable holds the name of the secret that
# will be mounted to the /grpccerts path on the Pod
grpcTLSCertsSecret: ""

# Set this if you are using HashiCorp Vault and want to communicate
# over TLS (recommended). This variable holds the name of the secret that
# will be mounted to the /vault path on the Pod
hashiCorpVaultTLS: ""

logging:
  operator:
    ## Logging level for KEDA Operator
    # allowed values: 'debug', 'info', 'error', or an integer value greater than 0, specified as string
    # default value: info
    level: info
    # allowed valuesL 'json' or 'console'
    # default value: console
    format: console
  metricServer:
    ## Logging level for Metrics Server
    # allowed values: '0' for info, '4' for debug, or an integer value greater than 0, specified as string
    # default value: 0
    level: 0

podSecurityContext:
  fsGroup: 1001
  runAsGroup: 1001
  runAsUser: 1001

securityContext: {}
  # capabilities:
  #   drop:
  #   - ALL
  # readOnlyRootFilesystem: true
  # runAsNonRoot: true
  # runAsUser: 1000

service:
  type: ClusterIP
  portHttp: 80
  portHttpTarget: 8080
  portHttps: 443
  portHttpsTarget: 6443

  annotations: {}

# We provides the default values that we describe in our docs:
# https://keda.sh/docs/latest/operate/cluster/
# If you want to specify the resources (or totally remove the defaults), change or comment the following
# lines, adjust them as necessary, or simply add the curly braces after 'operator' and/or 'metricServer'
# and remove/comment the default values
resources:
  limits:
    cpu: 1
    memory: 1000Mi
  requests:
    cpu: 100m
    memory: 100Mi

nodeSelector: {}

tolerations: []

affinity: {}
  # podAntiAffinity:
  #   requiredDuringSchedulingIgnoredDuringExecution:
  #   - labelSelector:
  #       matchExpressions:
  #       - key: app
  #         operator: In
  #         values:
  #         - keda-operator
  #         - keda-operator-metrics-apiserver
  #     topologyKey: "kubernetes.io/hostname"

## Optional priorityClassName for KEDA Operator and Metrics Adapter
priorityClassName: ""

## The default HTTP timeout in milliseconds that KEDA should use
## when making requests to external services. Removing this defaults to a
## reasonable default
http:
  timeout: 3000

## Extra environment variables that will be passed onto KEDA operator and metrics api service
env:
# - name: ENV_NAME
#   value: 'ENV-VALUE'

# Extra volumes and volume mounts for the deployment. Optional.
volumes:
  keda:
    extraVolumes: []
    extraVolumeMounts: []

  metricsApiServer:
    extraVolumes: []
    extraVolumeMounts: []

prometheus:
  metricServer:
    enabled: false
    port: 9022
    portName: metrics
    path: /metrics
    podMonitor:
      # Enables PodMonitor creation for the Prometheus Operator
      enabled: false
      interval:
      scrapeTimeout:
      namespace:
      additionalLabels: {}
  operator:
    enabled: false
    port: 8080
    path: /metrics
    podMonitor:
      # Enables PodMonitor creation for the Prometheus Operator
      enabled: false
      interval:
      scrapeTimeout:
      namespace:
      additionalLabels: {}
    prometheusRules:
      # Enables PrometheusRules creation for the Prometheus Operator
      enabled: false
      namespace:
      additionalLabels: {}
      alerts: []
        # - alert: KedaScalerErrors
        #   annotations:
        #     description: Keda scaledObject {{ $labels.scaledObject }} is experiencing errors with {{ $labels.scaler }} scaler
        #     summary: Keda Scaler {{ $labels.scaler }} Errors
        #   expr: sum by ( scaledObject , scaler) (rate(keda_metrics_adapter_scaler_errors[2m]))  > 0
        #   for: 2m
        #   labels:
To deploy KEDA, we only execute:
$ helm install keda kedacore/keda --values values.yaml --namespace keda
NAME: keda
LAST DEPLOYED: Mon Jan 3 9:42:31 2022
NAMESPACE: keda
STATUS: deployed
REVISION: 1
TEST SUITE: None
After a few seconds, you should have everything up and running:
$ kubectl get pods -n keda
NAME                                               READY   STATUS    RESTARTS   AGE
keda-operator-54885bb7b5-jmb4p                     1/1     Running   0          36s
keda-operator-metrics-apiserver-746d5d6bdb-gkhnd   1/1     Running   0          36s
3. Testing
Now we can test our deployment! 🎉
To test this we’ll use the good old nginx deployment. Let’s create our namespace keda-test first:
$ kubectl create ns keda-test
$ kubectl config set-context --current --namespace=keda-test
Now let’s create our nginx deployment:
$ kubectl create deployment nginx-deployment --image nginx
$ kubectl get pods
NAME                                READY   STATUS    RESTARTS   AGE
nginx-deployment-84cd76b964-rw4zt   1/1     Running   0          20s
With our deployment up and running, we deploy the KEDA resources necessary for the autoscaling:
scaledObject: sets our new HPA rules. We’re using the SQS scalertriggerAuthentication: tells thescaledObjecthow to authenticate to AWS. You can see here the different ways you can do this.
apiVersion: keda.sh/v1alpha1
kind: ScaledObject
metadata:
  name: aws-sqs-queue-scaledobject
  namespace: keda-test
spec:
  scaleTargetRef:
    name: nginx-deployment
  minReplicaCount: 0  # We don't want pods if the queue is empty
  maxReplicaCount: 5  # We don't want to have more than 5 replicas
  pollingInterval: 10 # How frequently we should go for metrics (in seconds)
  cooldownPeriod:  25 # How many seconds should we wait for downscale
  triggers:
  - type: aws-sqs-queue
    authenticationRef:
      name: keda-aws-credentials
    metadata:
      queueURL: https://sqs.<AWS_REGION>.amazonaws.com/<AWS_ACCOUNT_ID>/keda-test-queue
      queueLength: "2"
      awsRegion: "<AWS_REGION>"
      identityOwner: operator
---
apiVersion: keda.sh/v1alpha1
kind: TriggerAuthentication
metadata:
  name: keda-aws-credentials
  namespace: keda-test
spec:
  podIdentity:
    provider: aws-eks
If you set
minReplicaCount ≠ 0, thecooldownPeriodis 5 minutes, since the scaling from 1 ↔ N is handled by the HPA, you can check this issue for more info: Issue #737
Let’s apply this:
$ kubectl apply -f keda-resources.yaml
scaledobject.keda.sh/aws-sqs-queue-scaledobject created
triggerauthentication.keda.sh/keda-aws-credentials created
Now we can send some messages and see if our deployment scales! Go to the AWS SQS Console, select your queue (keda-test-queue in my case) and then Send and receive messages.

Here you can type any message you want and send it to the queue. Since our scaledObject has a length of 2, we need to send 3 messages for our deployment to scale up.

Once you’ve sent the 3 messages, check if the deployment is working with:
$ kubectl get pods -wAfter a few seconds you should see both pods running:
NAME                                READY   STATUS    RESTARTS   AGE
nginx-deployment-84cd76b964-475bt   1/1     Running   0          15s
nginx-deployment-84cd76b964-rw4zt   1/1     Running   0          3m
Remember that our polling time is
10 seconds, so count to 10 if nothing happens 😉
And that’s it! Our deployment just scaled up 🎉
To see if it scales down, you need to receive and delete the messages, so scroll down and click on Poll for messages:

Select the message you want and then click Done, this will delete the message from the queue.

After receiving all the messages, your deployment should scale down to zero:
$ kubectl get pods
No resources found in keda-test namespace.
Conclusion
And that’s it! If you made it to this point, it means you successfully deployed and tested KEDA with SQS.
To clean up your work, execute this:
# Delete nginx deployment
$ kubectl delete deployment nginx-deployment -n keda-test
# Uninstall KEDA release
$ helm uninstall keda -n keda
# Delete namespaces
$ kubectl delete namespace keda-test keda
If you have any questions/problems here, please feel free to join us on Craftech’s community Slack and ask around.
What is Craftech?
Craftech is a reliable, nimble and experienced infrastructure development group. Our team only consists of top level engineers, designers and managers. Craftech relies on the use of the latest accelerated development methodologies, tools, technologies and processes to deliver excellence in our solutions, communication and client experiences.
We have created Terraform modules to automate the work you have to do in this blog post. If you want more information, check our website.