Observability & SRE
Full visibility of your platform, from code to infra
Unified metrics, logs and traces. Detect and resolve before the customer notices. Open stack, no lock-in.
Lower MTTR, zero blind spots
The problem
- When something breaks, you're flying blind: you don't know where or why.
- Your resolution time (MTTR) is high and the customer finds out before you do.
- You have a thousand alerts and none of them tells you what actually matters.
- You can't trace a request end to end to understand the latency.
What's included
- Unified observability stack: metrics, logs and traces in one place.
- Actionable dashboards by service, team and business.
- SLOs, SLIs and alerting that flags what matters, without noise.
- Distributed tracing with OpenTelemetry, from code to infrastructure.
- Runbooks and SRE practices so on-call isn't chaos.
Open stack, no lock-in
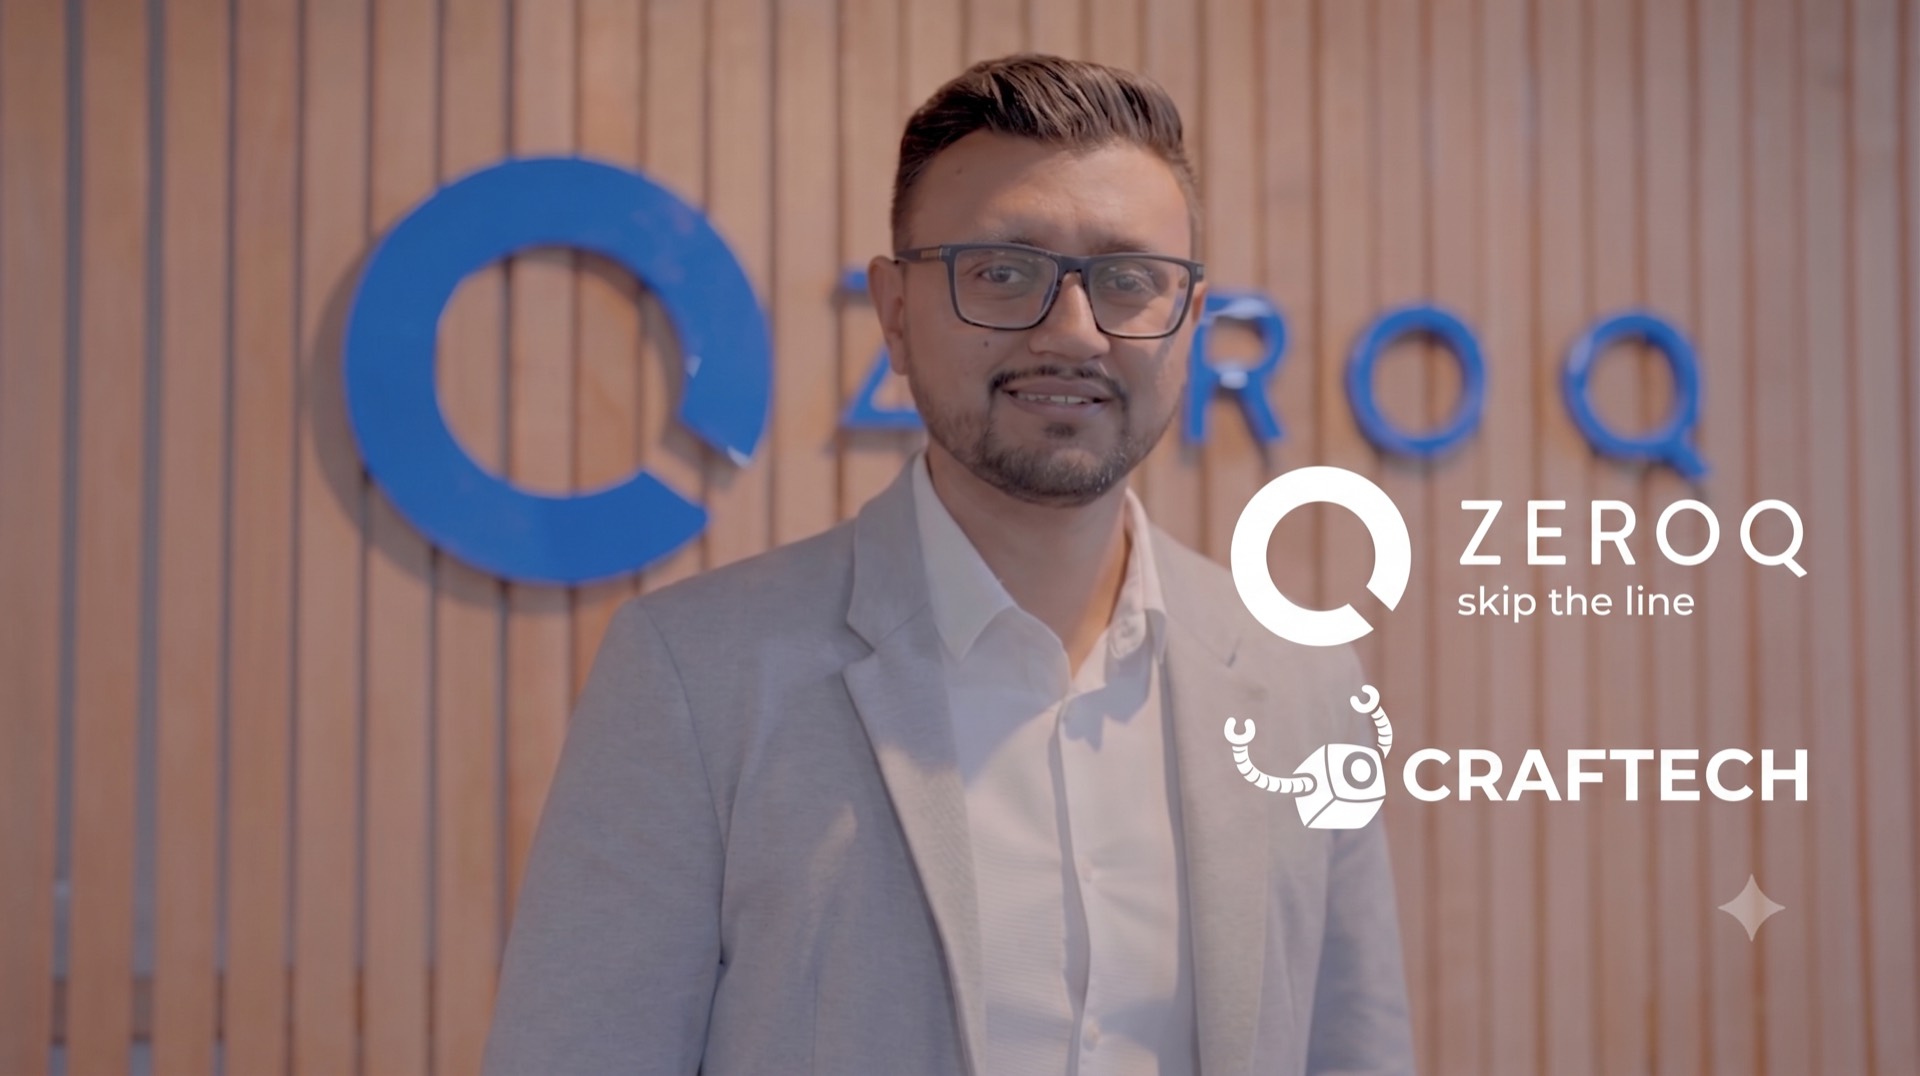
We work with Prometheus, Grafana, Loki, Thanos and OpenTelemetry: open standards that don't tie you to a vendor. It's the same stack we used to give ZeroQ real-time visibility after their migration.
How we work
Discovery
We map the visibility you have today and where your blind spots and recurring incidents are.
Plan & Quote
We design the observability stack and the SLO/alerting set, with clear scope and price.
Execution
We instrument your platform, build dashboards and configure useful alerting. We validate with real incidents.
Hand-off & MSP
We train your team on SRE and on-call. We can keep operating observability as part of your MSP.
Stack & technologies
AWS Credential
AWS Well-Architected Partner Program
The AWS Well-Architected Partner Program recognizes our ability to assess and improve AWS architectures across the six pillars of the framework: operational excellence, security, reliability, performance efficiency, cost optimization and sustainability.
We combine technical reviews with business vision to detect risks, prioritize improvements and define an actionable roadmap for each environment.
This program runs through everything we do: every migration, modernization or AI project is built on the same best practices that AWS audits.

Lower MTTR · real-time visibility
FAQ
Will I be locked into an expensive observability tool?
No. We use open standards (Prometheus, Grafana, Loki, OpenTelemetry). No per-host licenses that scale with your bill.
What is an SLO and why do I need it?
A Service Level Objective defines how reliable your service has to be. It lets you alert on what affects the customer, instead of drowning in metrics without context.
Is it useful if I already use CloudWatch?
Yes. We integrate CloudWatch with the rest of the stack so you get a unified view, not silos.
Do you have a real case?
ZeroQ: after migrating to AWS, we set up Grafana, Loki, Prometheus and Thanos for real-time visibility and lower latency.